


22.000 RESPIRI
Indoor Air Quality Monitoring

See what you are breathing in real time
intro'%3e%3cg%20transform='matrix(1,0,0,1,6387.385863,-2717.472761)'%3e%3cg%20transform='matrix(1,0,0,1,2774.39053,610.472761)'%3e%3cpath%20d='M971.173,5182C993.25,5182%201011.173,5199.923%201011.173,5222C1011.173,5244.077%20993.25,5262%20971.173,5262C949.096,5262%20931.173,5244.077%20931.173,5222C931.173,5199.923%20949.096,5182%20971.173,5182ZM971.173,5247C984.971,5247%20946.173,5208.202%20946.173,5222C946.173,5235.798%20957.375,5247%20971.173,5247Z'%20style='fill:url(%23_Linear1);'/%3e%3c/g%3e%3cg%20transform='matrix(1.3125,0,0,1.3125,2581.56812,-1033.902239)'%3e%3cpath%20d='M971.173,5182C993.25,5182%201011.173,5199.923%201011.173,5222C1011.173,5244.077%20993.25,5262%20971.173,5262C949.096,5262%20931.173,5244.077%20931.173,5222C931.173,5199.923%20949.096,5182%20971.173,5182ZM971.173,5244.857C983.788,5244.857%20948.316,5209.385%20948.316,5222C948.316,5234.615%20958.558,5244.857%20971.173,5244.857Z'%20style='fill:url(%23_Linear2);'/%3e%3c/g%3e%3cg%20transform='matrix(1.625,0,0,1.625,2413.745711,-2678.277239)'%3e%3cpath%20d='M971.173,5182C993.25,5182%201011.173,5199.923%201011.173,5222C1011.173,5244.077%20993.25,5262%20971.173,5262C949.096,5262%20931.173,5244.077%20931.173,5222C931.173,5199.923%20949.096,5182%20971.173,5182ZM971.173,5243.538C983.06,5243.538%20949.634,5210.113%20949.634,5222C949.634,5233.887%20959.286,5243.538%20971.173,5243.538Z'%20style='fill:url(%23_Linear3);'/%3e%3c/g%3e%3c/g%3e%3c/g%3e%3cdefs%3e%3clinearGradient%20id='_Linear1'%20x1='0'%20y1='0'%20x2='1'%20y2='0'%20gradientUnits='userSpaceOnUse'%20gradientTransform='matrix(351.338254,-130,130,351.338254,931.172917,5262)'%3e%3cstop%20offset='0'%20style='stop-color:rgb(0,203,179);stop-opacity:1'/%3e%3cstop%20offset='1'%20style='stop-color:rgb(67,97,238);stop-opacity:1'/%3e%3c/linearGradient%3e%3clinearGradient%20id='_Linear2'%20x1='0'%20y1='0'%20x2='1'%20y2='0'%20gradientUnits='userSpaceOnUse'%20gradientTransform='matrix(267.686289,-99.047619,99.047619,267.686289,856.377391,5262)'%3e%3cstop%20offset='0'%20style='stop-color:rgb(0,203,179);stop-opacity:1'/%3e%3cstop%20offset='1'%20style='stop-color:rgb(67,97,238);stop-opacity:1'/%3e%3c/linearGradient%3e%3clinearGradient%20id='_Linear3'%20x1='0'%20y1='0'%20x2='1'%20y2='0'%20gradientUnits='userSpaceOnUse'%20gradientTransform='matrix(216.208156,-80,80,216.208156,794.964761,5262)'%3e%3cstop%20offset='0'%20style='stop-color:rgb(0,203,179);stop-opacity:1'/%3e%3cstop%20offset='1'%20style='stop-color:rgb(67,97,238);stop-opacity:1'/%3e%3c/linearGradient%3e%3c/defs%3e%3c/svg%3e)
Every day we breathe approximately 22,000 times.
The quality of those breaths depends on the air in the environments where we live and work.
The Project was created to objectively measure the indoor microclimate and provide real data, not perceptions.
Homes, offices, schools, craft businesses: we spend most of our time indoors.
Yet we rarely have real data on what we are breathing.
Who it is for
areasPrivate individuals
Homes
Apartment buildings
Professional studios
Environments with mold, "heavy" air, or poor ventilation
Public entities
Schools and kindergartens
Public offices
Studies and practices
Libraries
Historical buildings
Companies and craft businesses
Hairdressers and beauticians
Artisan workshops
Technical studios and coworking spaces
Production environments using solvents, glues, paints, or chemicals
Spaces open to the public with high occupancy
Environments with mold, "heavy" air, or poor ventilation
In these settings, air quality is not just about comfort, but also health protection, professional responsibility, and corporate image.
Every environment has its own microclimatic dynamics.
Our task is to make it measurable.
What we monitor
whatThe system can continuously detect:
[ Click for details of each measurement ]
CO₂ (ventilation and air exchange indicator)
The primary indicator of air exchange
Carbon dioxide is not a pollutant in the strict sense at the levels normally found in indoor environments. It is the gas we produce by breathing. However, it is the best indicator of air exchange quality.
When CO₂ concentration increases in an enclosed space, it means the air is not being replaced sufficiently. In other words, we are breathing re-breathed air.
Elevated levels can cause drowsiness, decreased concentration, and a feeling of "heavy" air. In offices, schools, or meeting rooms, CO₂ is often the first parameter signaling insufficient ventilation.
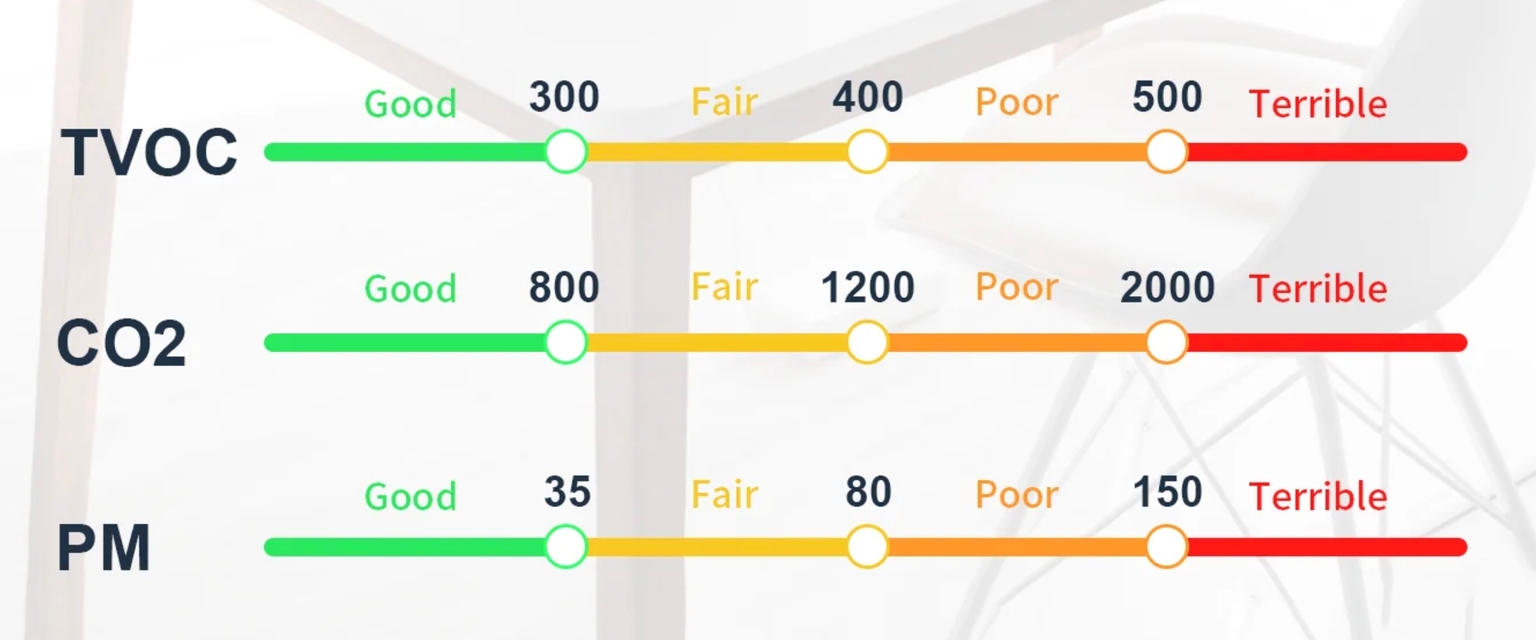
There is no rigid health limit for homes, but values below 800 ppm indicate good ventilation, while above 1200–1500 ppm action should be taken to increase air exchange.
Monitoring CO₂ means understanding if the building is breathing properly.
What we analyze in the final report
CO₂ is interpreted as a ventilation indicator.
In the report we evaluate:
- Average and maximum values during occupancy hours
- Time spent above indicative thresholds (800–1200 ppm)
- The environment's ability to recover optimal values
- Relationship between occupancy and air exchange
We provide practical recommendations to optimize natural or mechanical ventilation.
Volatile Organic Compounds (VOCs)
Invisible emissions from materials and products
Volatile Organic Compounds (VOCs) are gases released by many commonly used materials and products: paints, glues, new furniture, detergents, air fresheners, building materials.
They often increase after recent renovations or refurnishing. They can cause irritation, headaches, or discomfort in sensitive individuals.
There is no single regulatory limit for the total value (TVOC) in residential environments, but generally values below 300 ppb are considered good, while higher concentrations indicate the need to improve ventilation or assess emission sources.
Monitoring VOCs means understanding how much the environment releases substances into the air.
What we analyze in the final report
VOCs are interpreted as an indicator of internal emissions.
We analyze:
- Total average level (TVOC)
- Any increases in specific time slots
- Correlation with temperature and ventilation
- Possible emission sources (materials, products, furniture)
In the report, we indicate whether it is sufficient to improve air exchange or if it is advisable to evaluate the sources.
PM2.5 and PM1.0 (fine particulate matter)
The invisible fine dust particles
Fine particulate matter consists of microscopic particles suspended in the air. PM2.5 particles have a diameter of less than 2.5 micrometers, and PM1 particles are even smaller.
They can come from the outside (traffic, combustion, industrial activities) but also from the inside: cooking, candles, fireplaces, printers, craft operations.
The issue is size: the smaller they are, the deeper they penetrate into the respiratory tract. The World Health Organization recommends an annual average of less than 5 µg/m³ and a daily average of less than 15 µg/m³ for PM2.5.
In indoor environments, concentrations can increase rapidly during certain activities. Monitoring them allows you to understand which behaviors or situations most affect air quality.
What we analyze in the final report
Fine particulate matter is analyzed in relation to the activities carried out in the environment.
We evaluate:
- Daily trends and peaks related to specific events
- Persistence of concentrations after activities
- Comparison with WHO guideline values
- Possible internal sources or infiltration from outside
We propose potential reduction strategies (ventilation, filtration, behavioral modification).
Relative humidity
The balance between comfort and mold risk
Relative humidity represents the amount of water vapor present in the air. It is a fundamental parameter for both comfort and building health.
Values that are too low (below 35%) can cause dry mucous membranes and discomfort. Values that are too high (above 60–65%) encourage condensation and mold growth.
The optimal range is generally between 40% and 60%.
Monitoring humidity means preventing building pathologies and improving living well-being.
What we analyze in the final report
Humidity is evaluated in relation to comfort and mold risk.
We consider:
- Time spent outside the 40–60% range
- Daily fluctuations
- Relationship with temperature and occupancy
- Possible risk of surface condensation
We provide recommendations to rebalance the microclimate.
Temperature
Not just comfort
Temperature influences perceived comfort, but also the dynamics of pollutants and mold formation. Environments that are too cold can favor surface condensation; environments that are too hot can increase VOC emissions.
In winter the recommended range is 20–22°C, in summer 24–26°C.
It is an apparently simple parameter, but central to microclimatic balance.
What we analyze in the final report
Temperature is interpreted as a baseline parameter of the microclimatic system.
We evaluate:
- Stability over time
- Differences between time slots
- Impact on humidity and VOCs
- Consistency with comfort standards
If critical issues emerge, we suggest regulation and energy management strategies.
Atmospheric pressure
The parameter that helps interpret Atmospheric pressure is not a pollutant, but it is essential for interpreting data.
Pressure variations influence the ingress of gases from the ground, such as radon, and modify the balance between inside and outside. In some cases, they explain sudden fluctuations in monitored values.
It is a technical reading parameter, useful for understanding building behavior.
What we analyze in the final report
Pressure is used as an interpretative parameter.
In the report we analyze:
- Correlation with radon variations
- Any infiltration dynamics
- Influence of weather conditions
It serves to understand the behavior of the building as a whole.
Radon (dedicated monitoring)
A natural gas that cannot be seen, but can be measured
Radon is a natural radioactive gas formed in the ground from the decay of uranium present in rocks. It is invisible, odorless, and causes no immediate sensation. Because of this, it can be present in a building without us realizing it.
From the ground, it tends to rise to the surface and can enter buildings through small cracks in foundations, structural joints, pipe penetrations, or unventilated basements. Once inside, it can accumulate, especially on lower floors.
Prolonged exposure to high concentrations is associated with an increased risk of lung cancer. It is considered the second leading cause after smoking.
In Italy, the regulatory reference is Legislative Decree 101/2020, which sets a reference level of 300 Bq/m³ as an annual average. In workplaces, measurement is mandatory under certain conditions.
The key point is this: it is not the daily peak that matters, but the average over time. Radon cannot be perceived, but it can be measured and reduced with targeted technical interventions.
What we analyze in the final report
In the report, we do not limit ourselves to indicating the average concentration detected.
We analyze:
- Trends over time (daily and weekly variations)
- Correlation with atmospheric pressure and ventilation
- Presence of recurring peaks
- Comparison with the reference level (300 Bq/m³ annual average)
- Risk assessment based on building type
If necessary, we indicate the most suitable technical mitigation strategies for the specific case.
This is not a snapshot measurement, but an analysis over time that allows us to understand the actual behavior of the environment during normal daily or working activities.
Real-time monitoring
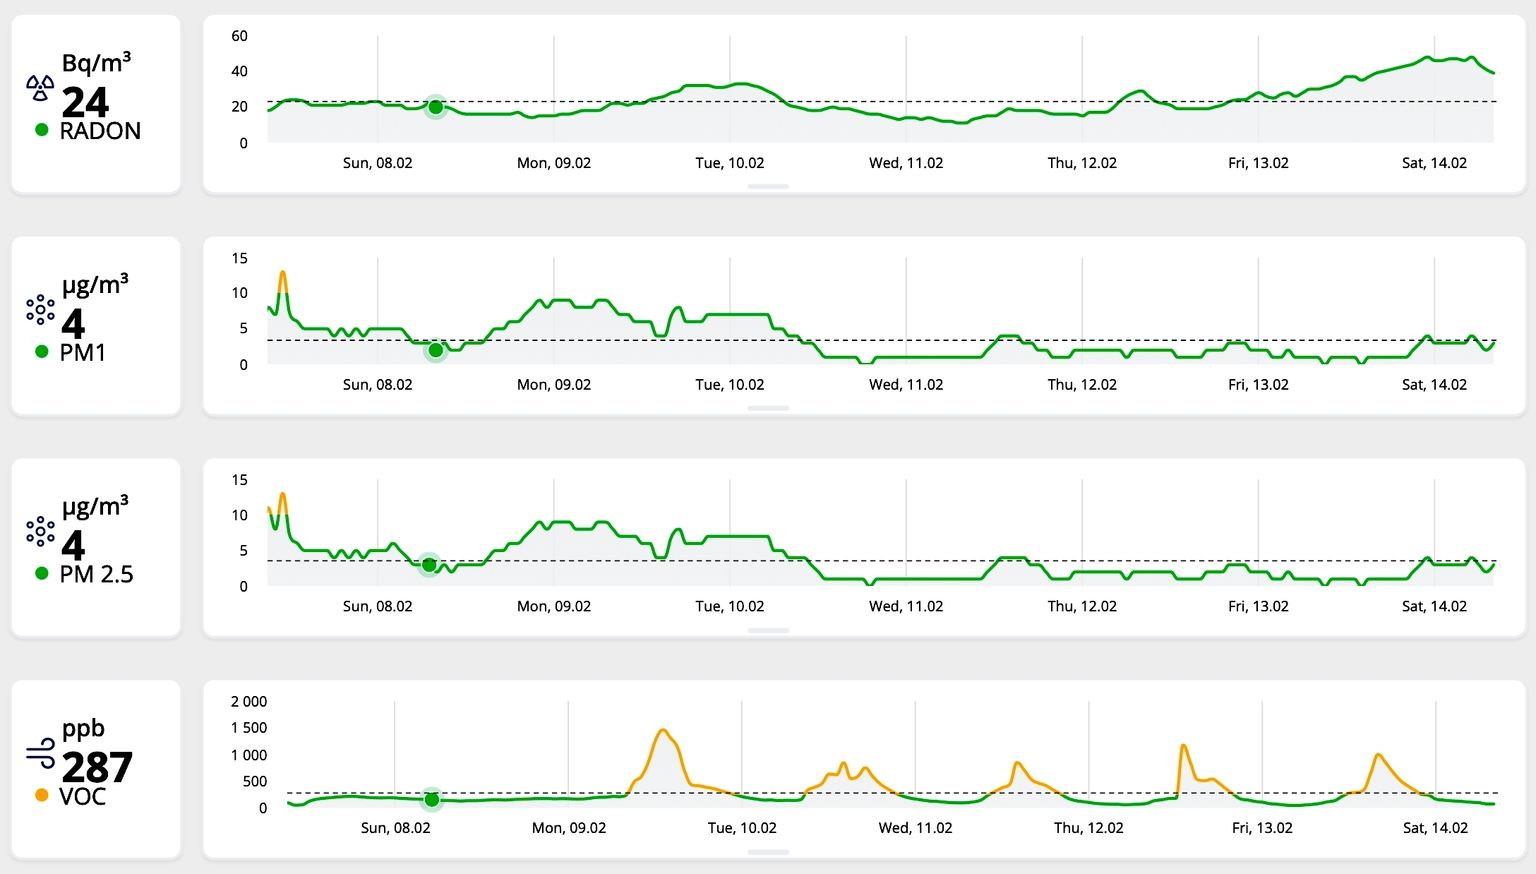
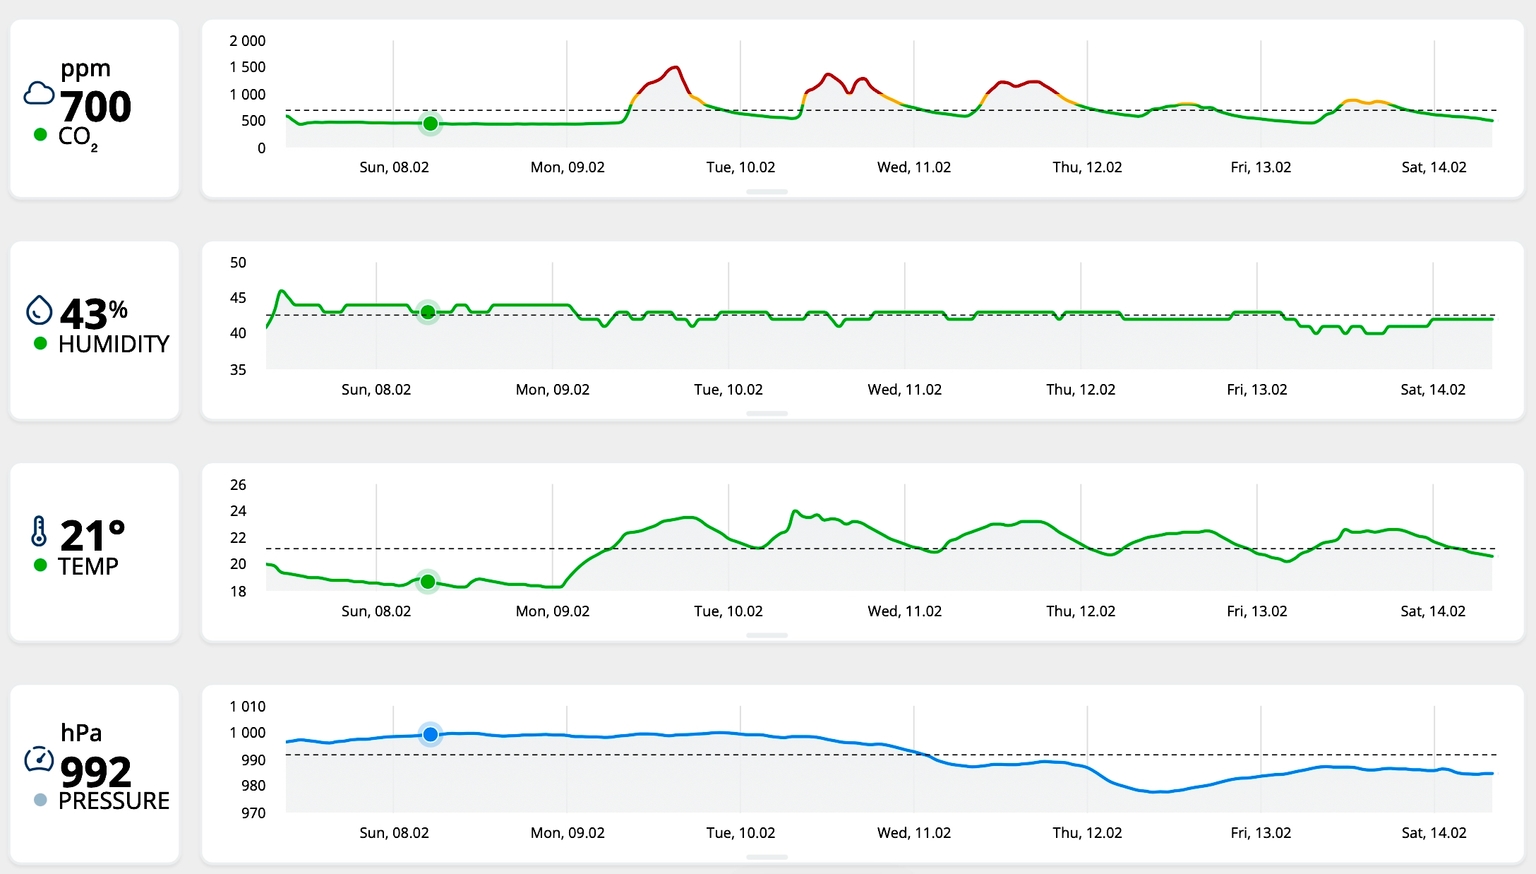
real-timeBelow you can view an active dashboard, connected to the device installed at our office.
Monitored parameters:
Reference values scale
Why monitor
whyIndoor air quality does not depend on a single parameter.
It is the result of the interaction between:
- Ventilation
- Materials
- Space occupancy
- Building behavior
- Outdoor conditions
A building can seem healthy and have invisible imbalances.
Or it can be energy efficient but with poor air exchange.
Without measurement, it cannot be evaluated.
Monitoring system rental
solutionsWe offer our devices for temporary rental to carry out a comprehensive environmental check-up.
10-day monitoring
Complete microclimatic analysis (Radon, CO₂, VOCs, particulate matter, humidity, temperature, pressure).
Ideal for:
- homes
- offices
- schools
- commercial activities
20-day monitoring (with Radon report)
Includes the evaluation of average radon concentration for 20 days, to ensure greater data reliability.
Recommended for:
- ground floors and basements
- historical buildings
- poorly ventilated environments
- properties undergoing renovation
- anywhere there is already a suspicion of Radon presence
How it works
howWe ship the device with installation instructions.
- Place the sensor apparatus following the instructions inside the case or by scanning the QR code to access a dedicated video. This device has autonomous batteries and does not need to be plugged into a power outlet.
- Connect the router to a power outlet. The router is already connected via radio to the device and will transmit data to our platform to begin monitoring.
- The system continuously records data.
- At the end of the period, the courier will collect the case containing the devices.
- We process a technical report and provide you with results interpretation and operational guidelines.
A responsibility-oriented service
responsabilityFor private individuals, it is a tool for awareness.
For public entities, it is objective technical support.
For companies and craft businesses, it is also an element of protection, transparency, and quality of service offered to customers.
We don't start from the idea that a problem exists.
We start from the desire to verify it.